Monday, March 31, 2014

Price intervals, DJIA, implications according to Bradley Cowan (“BC”) and the mother of all triple tops

In Market Science II (appendix C pg 117) BC points out several examples of extreme movements of DJIA according to squares of the 395 price interval.  Most notably in my mind:

Between the 1929 and 1987 tops there were pretty darn close to 6 squares of 395.  Here are bunch of contemporary examples:

You can take the rounded # of intervals and come up with some pretty interesting ratios.  18/12=1.5, 20/12=1.667, 26/18=1.44.
[In a separate essay I proposed SPX vibrates according to a 121.43 square.]

What’s the cause?  Per BC:
“Briefly, this happens when the PTV (Price Time Vectors) is pointing parallel to either the price or time axes, defining the limits of the square.”
Two components of that explanation.  First, parallel to the price or time axes and second, the limits of the square.
In “Four Dimensional Stock Market Structures and Cycles” aka 4D, BC develops his concept of PTV and the repetitive patterns of equilateral price triangles in the market.  In developing those concepts he describes the normal upright nature of market triangles.  They will randomly tilt right and left.  On page 27 he describes a triangle that tilts hard right relative to the price and time axes.  That puts the left side of the triangle very flat relative to the time axis.  That doesn’t exactly comport with the greatest rally in history, namely 2009 to 2014.  Very steep price rise.  But perhaps that’s not what is being measured.  Rather the very flat side being highlighted by the intervals is the period 2000 to 2014.  Fourteen years during which time the DJIA top increased from 11908 to just under 17000.  An upward slope but far less than a 1X1 Gann angle.  That’s the mother of all triple tops (triple tops do not have to be flat, they can slope upwards). 
So what happens to the right side of the equilateral triangle when the left side of the price triangle has such a flat top?   BC gives the example of DJIA from March to June 1991.  Sideways, upward sloping and the two days down 10%.  The triangle preceding the drop had a left side tilted well right.
The second part of BC’s discussion above; a square is ending.  Obviously, a cycle is ending.  The cubic structures on pages 84 and 85 show price retracing the edge of the square/cube in both the 1929-1932 and 8/1987-12/1987 declines.  When large squares complete, it would seem BC is saying ‘stuff’ will happen.  And what greater bull market has there ever been?  Arguably, 2009-14 is (soon to be 'was'?) the greatest.  And what has been the greatest of all triple tops?
 
Jim

Projecting a price interval to QQQs - outrageous


Yesterday’s post recounted the SPX price interval of $121.43 based on the 1987 extreme high and low which, multiplied by 11, explained the price increase from the 1987 low to the 2000 high
The essay examined a previous projection of SPX $1892 relative to the 2009 low and found a multiple of the $121.34 interval of 10.09:
1892, maybe, maybe not.
 
Might an interval be involved in the final QQQs top in 2014?  Start with defining what might be an interval.  One method might choose QQQs inception and first trade $50.64 on 3/10/1999 as the low and the remarkable high of $120.50 on 3/24/2000. Alternately, the low might be defined as the actual low between inception and the high which occurred on….3/24/1999, exactly one year before the all time high (can’t make this stuff up) of $48.50.  The interval computed both ways would be:

Goodness, another X file number;  the price interval based on the actual low is exactly $72 as in Bradley Cowan’s Pentagonal Uranus cycle.  Exactly 1 year between the 3/24/2000 high and 3/24/1999 low and the change in price is 72.  I wonder if the Pentagonal Uranus cycle, 1/5th of the circle, one half the square of 12, might play a role in the price life of QQQs?
So, what would be the projections of the high price in QQQs IF the price interval plus the next previous extreme low prove to be accurate?
The projections under the alternate methods would be $94.91 and $97.05, respectively.  Recall previous square of 9 projections for $94 for the weekend of 3/30/2014; either Friday (which didn’t occur) or Monday. 
If $94 gets tagged today it will require an 8% one-day rally.  I vaguely recall Nassim Taleb in 'The Black Swan' citing the probability of a 10% one-day index change being way out there on the normal distribution’s tail.  And yet, it’s occurred many times.  And QQQs had several $10 one-day in March/April 2000.  But now is not dot.com.  8% might happen this time, but it’s probably on the level of a trifecta wager.
Since I'm finding the bizarre (price increase of 72 in exactly 1 year) and considering the vastly improbable, let's talk really outrageous.  How about QQQs touches $97 and closes $94?  How many Nasdaq points do you need for that?  About 300...hehehe?
Jim

Sunday, March 30, 2014

Support for a projected SPX top of $1892; the 1987 price interval OR something higher?

Looking for some support for the square of 9 derived price of $1892 (see previous post) I decided to try and replicate a similar procedure that I’d seen used with DJIA and the 1982 price interval extrapolated to 1987.  [In Appendix D to “Market Science” by Brad Cowan multiples of the price interval of 395 was found in 1982 to explain 1987 ranges in DJIA.]  The ‘price interval’ is the SPX high on 8/25/1987 minus the low price at the bottom on 10/22/1987 or 121.43 derived in the table below.
Let’s see if there’s some coincidence between the 10/22/1987 low and the 3/24/2000 top:

Pretty much a 11 X 121.43 to two significant digits.  And then a major bear market.  Actually, a huge dot.com crash in Nasdaq.  [ It doesn’t work for the move up from 10/10/2002 to 10/11/2007 high.] That’s the way it worked in DJIA but the multiple was 395. 
Now the critical part; is the move from the 2009 low to the projected high a multiple of $121.43?
 
Yup.  10 X 121.43 to two significant digits.  It’ll make a great appendix to something if it happens….perhaps a revival of "Mad" magazine?
If I wanted an exact multiple of 10, I'd want to see 1881.09 (666.79 + 10*121.43) but the intraday high has already exceeded that level twice.  The closing price has not reached that level.  Perhaps the calc needs to use closing prices....yada yada.  Regardless of the hair splitting one might undertake, SPX is at a very critical level of vibration.
Always a fly in the ointment.  Let's take the above methodology one step farther...to the 11th multiple:
That puts SPX at 2002 but what I immediately spot is the 11th multiple of the interval is....exactly twice the 3/9/2009 low.  And the ending price is three times the beginning price.  That is troubling.  For that to occur and for the square of 9 projection to work the market needs to continue climbing for another 120 or so days (a 1X1 angle) I believe.  A high that triples the beginning price and puts time in the crash worthy August time frame.

I'm still in the 'sooner rather than later' but with my eyes wide open.
Jim

Saturday, March 29, 2014

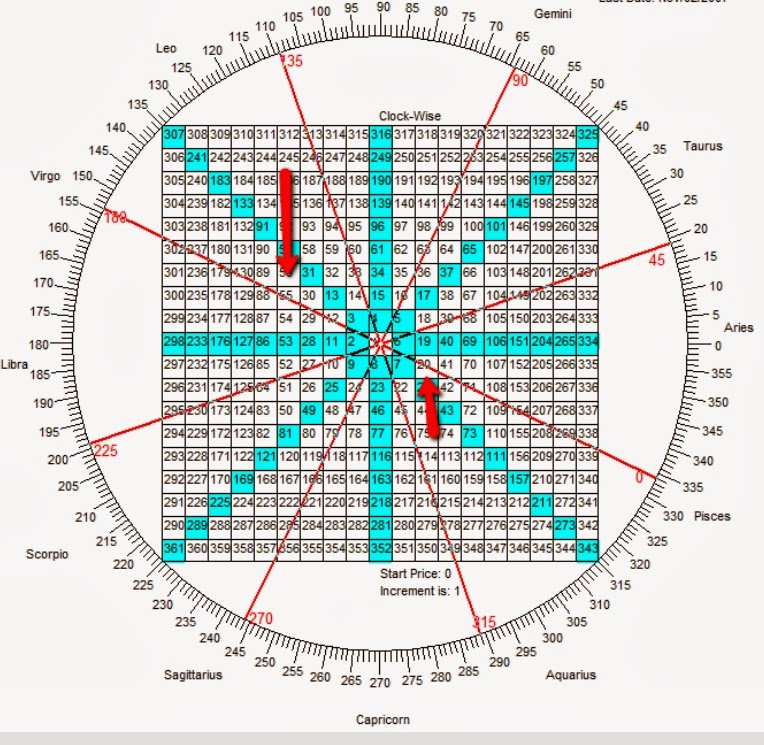
SPX $1892 Monday or Tuesday according to the square of 9?


Reading yet another newsletter that called the SPX top in at March 6, 2014 price of 1884 based on a simple square of 9 application.  The analyst put 677 in the center of the square of 9 and found 1884 on the north cardinal cross.  The conclusion drawn was that March 6, 2014 might have been the high (the analyst used other metrics as well).  That perked me up, but it didn’t tell me when.  But the square of 9 struck several discords with me.  Why use the closing price on 3/9/2009 to infer the final high for the market at some unspecified future point?  Here’s a replica of his chart with both the price and the cell count in the cell (the analyst had only the price in the cell):
I don’t think the method is invalid.  But it seems kinda puny to forecast only the price.  What assumption do you make when the market gets there; immediate touch and reversal?  My understanding is that Gann tried to coordinate time and price in square of 9 projections.  I’ve read Gann was often seen on the NYSE floor with only a square of 9 chart and an ephemeris.  Let’s look at the SPX square of 9 chart with the low price in the center and make some observations of both time and price:

I spotted a couple numbers that I liked based on my bias for March 30, 2014.  On the diagonal cross at 225* I found 1849 as a number of days since the March 9, 2009 low and I found on that same diagonal a price of 1892 which is close to the current high of 1884.   The 1849 days is noteworthy because March 6, 2009 plus 1849 days is April 1, 2014…darn close to the my March 30, 2014 projection.  And, as I recall, the March 2009 low was a “straddle.”  DJIA bottomed March 6, 2009 while SPX bottomed March 9, 2009.  On top of that, I recall the low SPX print was in the first hour of trading on March 9, 2009.  April 1 is pretty close to March 31.  Duh.
So what, the 1892 square of 9 price falls on the same diagonal cross 225* as 1849 days?  Still not a lot of meat on that bone.  So I tried to find some astro reason why that date might be important. I couldn’t find a thing by charting the planets on the outer ring.  So I set my outer ring back from April 1, 2014 to Sunday March 30, 2014 and what did I realize? 

Sun/Moon conjunct at 9* is 144* from the 225* diagonal which contains the 1849 days (April 1, 2014) and a price of 1892.  As I often say, you just can’t make that stuff up.
It’s a little inexact.  If you look at the number, SM conjunct actually occurs at about 9.9*, not the 9* that the charting software displays, but you can shimmy that 225* to 226* which will give you 144* and a price of 1891 and 1848 days.  I rather like 1848 days a bit better because it gives me Monday, March 31, 2014 which is, in substance, the March 30, 2014 top I’ve been pounding on for a month.
There’s a little more but I’ll just point you to the previously posted Saturn/Uranus essay that supports March 30, 2014, again, Monday March 31,2014 in substance.
So, I’m looking for SPX 1891 Monday or 1892 Tuesday (about 1.8%).  [Out of full disclosure, I've used the same method to project QQQs $94 on Monday, a very unlikely event that would require an 8% increase in 1 day.  Done before but unlikely.]
Crash and burn time for my projections.  It'll be back to the books to ferret out the likely errors in my understanding and methods.
Jim

Friday, March 28, 2014

Gann’s Mean of Five and Cycle of Eight and IBM - Canary in the coal mine?


I recall the 2002 bottom when EWI were calling for the dreaded further decline into the unfathomable abyss….we all know how Prechter and Hochberg can paint it.  And then IBM announced.  The next issue of the Short Term Update was “we don’t know what happened or where the EW count is but you need to move to cash.”  Several days/weeks later there was a re-thunk cycle count at the largest levels (expanded/irregular flat perhaps).  Ditto the 2008 bottom where IBM, with Nasdaq 100 in tow, bottomed on 11/21/08, three months before the broader market.
Today I was reading a newsletter that argued so goes IBM so follows the market and I would not hazard to disagree.  That newsletter applied “planetary lines” to show IBM’s movements relative to the stars ….a method revealed in his book.  Hmmmmm, what might those esoteric methods be that would cost me the price of the book and the even more expensive use of my time?

In about 5 minutes I’d reproduced his chart.  Simply Gann’s “mean of five” (the large 6 planets minus Mars):

The MOF 2X1 cradles the 2013-14 lows and, arguably, halts IBM’s price decline.  The 3X1 is equally as dramatic as price forms around it to the top.  And once the top was in and line was broken there was a steep decline to the 2X1. 
Gann’s “Cycle of Eight” has an even better micro correlations with IBM price and some interesting implications:


Each of the above angles correlate with price for a segment of time and when price departs that line it falls quickly to the next lesser angle.  So what about the 1X8, IBM price is only halfway there?  If you put a Fibonacci retracement on the drop from the very top in March 2013 (215.90) to February 2014 (172.19), you’ll see that IBM has recovered about midway between 50% and 61.8% of that loss. 
Now especially note that IBM topped in 2013 and is a good 40 points or 20% from that ascending COE 1X4 planetary line.  Does IBM’s top in 2013 lead the indices, that is, lower?  Or is the market now leading IBM by having made new highs with IBM to follow? 

My expectation is that IBM recovers to 61.8% (199.21) and then…..
IBM releases quarterly earnings on 4/16/2014.
Jim

Square of 9 price perfection


Every extreme price of QQQs are simultaneously in aspect on a 45X45 square of 9 chart.  Here are the extreme prices in QQQs including the price I've previously projected:

The following is a 45X45 square of 9 chart that is structured to project the high price and day of that high price based on the previous low price.  So, in the center of the chart yoy will see $26 which is the 10/31/2008 low in QQQs at $25 +1.  The sq of 9 counts days from that center with each cell incrementing 1 calendar day and it counts price incrementing $1 per cell.

You’ll Sun/Moon at the right of the chart conjunct.  That is because planets are shown on the outer ring at their longitudes on March 30. 2014 (Sunday).  That date is the first full moon after the Spring Equinox, a date that Chris Carolan says is key to locating a focus for a Spiral (“The Spiral Calendar”). 

Let’s assume Sun/Moon conjunct on March 30, 2014 is the 0 degree line, well it is obviously conjunct relative to the $26 center cell price.  But it is square the $120 all time high, and trine both the natal price of $50 and the 10/31/2007 high of $55.   The only price on the above table that is not found on this chart is $20 which is the 10/10/2002 low.  It simply is not on the chart because the beginning and lowest price on the chart is the most recent low.  I have previously charted this price and it should always be in aspect with at least the 10/31/2007 high of $55:

The money shot of all this is the $94 price which falls on the Moon/Sun conjunction longitude.  That longitude actually falls squarely between $93 and $94 so I could interpolate it at $93.50.  But that would be based solely on Sun/Moon.  There are several other planets in aspect with that price area that I interpret as preferring a slightly higher price so I subjectively settled on $94 for the day before or after Sunday March 30, 2014.  If, in the apparent unlikely event that this does occur (QQQs are at $87 at the time of this writing), it would make sense the “powers that be” will want to paint the best quarter end possible on March 31.  I’ve previously preferred March 28 but we’re kinda splitting hairs here.
As well, on that Sun/Moon longitude you’ll see one final notable number; 1955.  The center of the Sq of 9 was $25 which occurred on 11/21/2008 plus $1.  That date plus 1955 days is 3/30/2014.

It all hangs together pretty nicely BUT there is a fly in the ointment.  $94 is not the only  price that will form aspect with the Sun/Moon longitude line and other prices.  $85 is square the Sun/Moon longitude and conjunct the 3/24/2000 all time high.  And $89 is semi square both longitudes.

Still, I like $94 but its becoming a stretch.

Jim

Thursday, March 27, 2014

Time symmetry, a further study in 2000 QQQs


Nature likes symmetry.  The orbit of planets about the Sun are non linear but, ultimately over the various grand cycles, symmetry occurs.  As Gann point out in his seemingly odd essay on “The Human Body” we have 2 of many of our prominent body parts located symmetrically on our bodies.  Not so oddly he encourages us to study historic prices, times and angles in order to understand how the position of a stock relates to a given starting point.  Behaviorally, we want to see symmetry, rhythm, diatonic harmony, vibration.  Historic pivot times and price combined with a starting time and price and an understanding of symmetry provide a means to project future stock position.  [There’s much more to be taken from that very short meaningful essay.]
So, following my theme of QQQs in 2000, might we investigate time symmetry?


Let’s look at the first most startling observation (IMO) about the above chart.  Look at the very bottom time measurement line, 376 calendar days from the March 24, 2000 top to the very significant interim low on April 4, 2001 (black arrow on the right).  What’s so significant?  Well, look left to the time measurement extending left from March 24, 2000 and ending on exactly March 17, 1999 (black left arrow).  That is the first day where the databases to which I have access have trade quotes for QQQs.  I would assume March 17, 1999 is the “first trade” for QQQs although I see in numerous places the first trade actually occurred on March 10, 1999.  Regardless if there are 376 on the left side or 383, there’s an ‘in your face’ symmetry between the first trade date and the prominent April 4, 2000 bottom.
But it doesn’t end there.  Move time measurements inwards and you’ll find numerous symmetries between extreme price pivots pre and post top.  Notice I say “extreme price pivots” because it appears the pivots are not always bottom-bottom or top-top.  Rather, and I hate to use the cycle analyst’s favorite excuse for his failed projection, somewhere prices “inverted” from top-top or bottom-bottom to top-bottom.  Enough said there. Just expect symmetrical pivots on the right side based on pivots on the left and trade the turn whatever’s next in line.

Let’s drill down a little farther with another chart of the 2000 top:

My gosh, nothing symmetrical in the first micro squiggles after the top on March 24, 2000!!!  It seems the “focus” of the symmetry is a bit off.  Well, March 24, 2000 was not the focus of the symmetry we seek.  Perhaps the true focus occurred on Saturday or Sunday or dead in between.  Let’s re chart the 2000 top and measure the periods to the left using Saturday March 25, 2000 as the focus and measure right with Sunday March 26, 2000 as the focus (effectively this allows us to anchor between those 2 days).
That’s much better.  Symmetry achieved.  Let’s consider a concept from Chris Carolan’s “The Spiral Calendar” page 53
The focus of a spiral or partial spiral will tend to fall on a moon phase near a solar seasonal change, and/or an emotional market turning point, or a golden section division of a larger spiral.
[Just for interest, March 24, 25, and 26 are all within 4-6 days of the March 20, 2000 spring equinox and straddle the full moon (March 20) and last quarter moon of that year (March 28).]
The weekend dates of March 24, 2000 proved, in retrospect, to have been a very powerful emotional market high and certainly near the spring equinox.
So why wouldn’t a left handed spiral (the decreasing intervals of the left side of the chart) have the March 24, 25, 26 dates as a focus AND the right side of the chart (the increasing intervals of the left side of the chart) as a joint focus for both.  As such, the right side of the chart becomes a mirror reverse of the left.
Symmetry.

If March 30, 2014 proves to be a focus point, might we predict the critical dates thereafter?  If March 21, 2014 is, as some have suggested "the" major market high, then shouldn't the participating indices already have begun showing signs of symmetry?  Questions for a later date.
Jim

Wednesday, March 26, 2014

My Happy Ending, 2000 redux


DJIA topped 12/31/2013 and is completing very minor wave 2 of the new Bear imminently.
 
SPX is in a very slightly ascending ending diagonal triangle with its ending imminently.

 
QQQs are in a steeply ascending diagonal triangle with its ending imminently.

 
Unless you are referring to DJIA, the top does not appear to be in IMO.  If it works out as the 2000 topping model I discussed in a previous post, we get a top in the next 3 trading day in SPX and QQQs but DJIA, "no top for you."  If so the ensuing 12 calendar day will be hell to pay...but only a down payment.
Of course I’m biased.  I first posted this speculation more than a month ago.

[Pardon the incorrect EW labeling.]

Jim

SPX top in on March 21, 2014?, a study of major tops


An analyst previously on board with March 28, 2014 capitulated this week in favor of SPX having printed the ‘final’ high on March 21.  If “the” top is in, what might we expect within the week from now?
In 1987, SPX topped on 8/25/1987 and within the next 14 calendar days it lost 9%:  NDX topped later on 10/6/1987 and, within 14 calendar days, lost a full 33.5% of its value.

 
In 2000, SPX and QQQs topped on 3/24/2000.  Within 11 calendar days, SPX lost about 9%.  Within 11 days, QQQs lost 26%.


In 2007, SPX topped on 10/11/2007 and within 11 calendar days lost an unremarkable 5.4%. QQQs topped later on 10/31/07 and lost 11% in the next 11 calendar days.


If, then, SPX topped March 21, the minimum first minor wave down would be take SPX down about 5% by Wednesday of next week.  Of course, if the 2007 scenario is correct we might expect that QQQs held the market up for that extra 20 days as it made its final high.  Regardless, 5% by next Wednesday would be a reasonable minimum expectation based on the history cited.
Personally, I’ll stick with the one more QQQs high for another…. err…3 trading days (Monday)...and SPX with another marginal high.  I’ve long felt the 2000 model with SPX and QQQs making a high on 3/24/2000 some 2 plus months after DJIA is the best fit.  At this date, the reigning DJIA high is 12/31/2013, two weeks earlier than the comparable 2000 DJIA top. 
Regardless of what constitutes a 'happy ending' for me, if SPX was a March 21 top, then expect something very very soon. 

Jim.

QQQs $94 March 30, 2014 needs a Spiral Calendar sticksave

It's more unlikely with each day that QQQs make it to $94 by the weekend of Sunday March 30, 2014 (Friday or Monday), particularly after today's drop.  As explained in the “dilemma” post a couple days ago there was a cluster of projected pivots from March 20-24 which I interpreted as a bottom and top.  Turns out with today’s low that was lower than March 24, that cluster marked a top and did not mark the bottom as well.  Only a top.

The only way Spiral Calendar dates can make the projected high on the weekend of March 30 is if there is a projected pivot for March 27, 2014 (tomorrow) that I haven’t discovered.  And, after scanning again and again, there is:

It’s pretty un-encouraging because I found 3/27/2014 projected only twice; not several historic dates projecting March 27, 2014.  Of a little comfort is it makes use of the 14 SC interval which is based on the Fibonacci number 144, e.g. sqrt(144) / synodic lunar month = 354.4.  Of course, 354 days is the synodic lunar year and Carolan had some very good things to say about the 12th SC interval and the SC 34th interval   (which links the 1929 and 1987 crashes) because they are a whole number of moon cycles (12 cycles in the 12th SC interval and 717 intervals in the 34th).  As is obvious from the above table, both pivots were bottoms and that's what the March 30 projection needs in the worst way.

Discomforting is the puny nature of the bottoms.  In reading Carolan, it’s not necessarily size that matters:

A bottom tomorrow morning and one heck of a short squeeze into the end of the quarter Friday/Monday.

Jim

The mother of all Ponzi's? Some recollections of 2008

Background:  The day of Lehman I was watching, as usual, CNBC at the open.  The reporter on the floor of the NYSE at the open was asking brokers what was going on and one broker said everyone was calling their wives to tell them to withdraw as much cash as they could from the banks.  The reason was banks might not be able to operate as usual and honor transactions drawn on other banks.  In other words, you write a check to pay for dinner on your then Wachovia checking account and give it to the restaurant cashier who would otherwise normally deposit it into their Nationsbank account.  But the cashier, knowing that Wachovia has troubles and knowing that Nationsbank knows it, won't take the check because she knows that Nationsbank won't take it because Nationsbank knows the Federal Reserve can't clear it against Wachovia because Wachovia no longer has reserves at the Fed.  That day the interbank borrowing rate sky rocketed (see the below chart from Wikipedia regarding the "Ted-spread") reflecting the distrust among banking institutions.  That day General Electric, the consummate borrower in ultra short term commercial paper, had about 4 days of cash with which to operate and there wasn't a bank that would touch them (enter Warren Buffet with Fed and US Government guarantees).


As we know, the Fed has gone to extraordinary measures in shoring up and fixing the banks.  And, by most ongoing standards and, supposedly, the 'stress' standards, the banks are fixed.  Lot's of reserves at the Fed, no problem.

But the Fed has nearly $5T of debt and assets now where pre 2007 it had less that $1B.  All the bad paper that was off loaded from the banks and low yield US debt.  A lot of that stuff has 'seasoned,' but a lot of it hasn't.  A lot of it is short term US debt but a lot of it is not.  I caught an interview with a regional Fed president yesterday (March 25) and he wasn't exactly comfortable with the size of the Fed balance sheet or what would happen during the forthcoming unwind.  I recall an article several months ago about how large the paper loss was at the Fed when the US 10-year budged up XX basis points that week (it was on the order of 20 basis points and they lost $100B).  I even more vaguely recall that in 2008 part of the Fed's actions were predicated on the Federal government backstopping Fed losses during the 'extraordinary measures' period.  Geez.  

Questions.  So, we have solvent banks but a potentially insolvent clearing mechanism.  What happens if the Fed burps?  Who will become the clearinghouse between individual banks if its one clearinghouse, the Fed, is not creditworthy?  Do banks revert to the horse and buggy days where each city's bankers meet with one another and hand checks back and forth to clear their accounts ("city clearing").  So now its not 5 or so 'too big to fail....its one too bigger to fail?

And what about the value of that mandatory Fed account on each individual banks balance sheet?  The individual banks become balance sheet insolvent again-all Fed correspondent banks.

And can a government with $17T in debt and an annual deficit of $1T (plus or minus $500B, but who's splitting hairs) credibly backstop a failed banking backstop?

What a Ponzi.

[Do check the 'facts' above as its all recollection.]


Jim

How big a rally would be big? Studying some Gann angles and QQQs


Big is relative.  Sitting in my then Big 8 CPA partner’s office we were discussing a $25M immaterial adjustment we were going “pass” making our Fortune 500 client book before earnings release.  We’d just finished talking about a $25K adjustment that we required that a much smaller private business make because it was material.  The partner shook his head and said “We can’t make them book the $25M because it is clearly immaterial, but, you know Jim, some numbers are just plain big.”

Start with a reasonable step value by fitting the 1X1 angle to the 2002 bottom to the 2007 top in QQQs.  The step value is $.0191 per day.  Here’s a chart of that time period with the blue vector the 1X1 set at that step.  Perfect:
Now let’s look at the red 2X1 Gann angle at that step anchored to the QQQ bottom (the QQQ bottom was in November 2008 in advance of the other indices):

The 2008 rally to date pushes the 2X1 or twice the ascent of 2002-2007.  Not shabby.  But let’s drill on the last 52 days of the rally which I have projected to occur the weekend of March 30, 2014 at QQQs $94:
To achieve $94 based on the low that occurred 53 calendar days before March 30, 2014 (I picked 52 for several reasons) I need a 10X1 rocket (the heavy black vector).  That seems pretty material.
But let’s look back at the 2000 period.  From the March 10, 1999 natal time and price, QQQs sustained just shy a 10X1 angle to the March 24, 2000 top.  That’s 10X1 for a full year as opposed to 53 days:
 
One last time, drill down on the last 53 days of that one-year rally.  The low comparable to 2014 occurred on January 31, 2000, actually 54 calendar days before the March 24, 2000 top but I’ll “pass” on the one-day difference between 2000 and 2014.  Okay, fit a Gann angle to January 31, 2000 bottom to March 24, 2000 top with the same step value as all the other angles.  It is the brown 36X1 angle.
10X1  for 53 calendar days in 2014 is a really big number..... but next to 36X1 in 2000?  Immaterial.
By the way, a 54 day period is 1.85 days different from the 51.15 day 4th Spiral Calendar interval.  I wonder if Brach Cowan would be interested in the number 36 being half the Pentagonal interval.  Or 10 being 1/36th of the circle?

Jim

Tuesday, March 25, 2014

QQQs 2000 and 2014, just interesting

With time to burn before the rendezvous with prognostication failure (QQQs $94 the weekend of March 30, 2014), I decided to look back at the last 10 years of QQQ run-up to a final high.  Of course I looked at the great 2000 market high in QQQs which will be exactly 180* of hello Saturn from that date on March 30, 2014.  Get the drift already?


Very simply, QQQs double bottomed on Tuesday March 20, 2000 (the bottom was 3 trading days earlier on Thursday), a mere 4 trading days before the March 24, 2000 top.  From that point to the March 24, 2000 high, QQQs increased 16.32 points or 16% in 4 trading days.

Today, it appears QQQs has double bottomed off the low of 1 trading day earlier.  To reach the projected $94 target on Friday March 28, the market will have to gain 7 points from yesterday's bottom or 8%.  

This is a different time, however…..hardly a dot.com mania.  

Extending that timeline, look at what happened in the next 11 calendar days to the first discernible bottom on April 4; the market declined 32 points.  Look at the Fib retracements.  The first bottom on Thursday March 16, 2000 represents 61.8% of the subsequent first wave down April 4, 2000.  And the double bottom on March 20, 2000 represents 50% of that same subsequent decline.

Remember, what occurred in 2000 is exactly 180* of hello Saturn ago.  

Jim

Monday, March 24, 2014

Whoosh - QQQs March 24, 2014, a Spiral Calendar dilemma

I had very few SC points for DJI that indicated March 20-24 as turns but I had several for QQQs:

The yellow highlighted dates are the pivot date + the SC interval.  Under the column historic pivots, I have one date highlighted in red which means in my spreadsheet referencing that that particular day was a very big pivot in QQQs.  And that line out at the far right gives me the future date of today March 24, 2014.  Of course, there are other dates that corroborate today as a pivot candidate.

I did not know what to do about so many dates from 3/20/2014 (Thursday) to 3/24/2014 (today).  So close together, it would seem like a whipsaw were there to be a top and bottom in those 3 trading days; a relatively minor event.  But, as we see, the last 2 days are not minor in QQQs.

Adding to my distress DJI which seemed to dispute the the large number of QQQs' projected pivots in just 3 trading days.

My perception at the moment is the pivot in DJI is negligible as SC had indicated it was and I correctly interpreted AND the pivot in QQQs is as severe and will be as temporary SC indicated and I incorrectly ignored.


The March 20-21 dates in yellow, then, project a top and March 22-24 dates infer a bottom today.  Allowing 1 day in the projection and tomorrow could be the bottom.

So, I continue to believe QQQs must recover (at the moment trading at 88.16 and was trading as low as 87.41 today) and will at least touch the 94 area Friday March 30.  From the low of today that would be almost 9% in the next 41/2 trading days.

Jim

Sunday, March 23, 2014

QQQs square of 9 joint time and price projection


QQQs bottomed ahead of SPX and DJI on 11/21/2008 and double bottomed with a higher low on 3/9/2009.  As an attempt to pinpoint both time and price on the same square of 9 chart, the bottom price on 11/21/2008 of $25 was used as the starting point for the chart (the center becomes $25+1) and also inserted in each cell the date.  Each cell is $1 greater than the previous and 1 calendar day greater than the previous.
 

In addition I plotted on the outer rim the geo position of Sun-Moon on 3/30/2014 which are located at 9*.  The planetary line of intersects two notable cells on the square of 9.  That line intersects the price cells of 93 and 94 indicating a price in the upper 93s and lower 94s, consistent with my previous projections of price.  Moving out to the last rotation on the square of 9 the Sun-Moon planetary line intersects 1955.  This would indicate the 1955th calendar day since the 11/21/2008 low.  And what do you get when you add that date plus 1955 calendar days?


March 30, 2014, a Sunday, and my previous projected weekend top based on The Spiral Calendar and other measurements.  What’s different is that it’s a square of 9 projection of both time and price at the planetary line established by the first new moon after the Spring Equinox…a highly favored date for a spiral focus in Chris Carolan's The Spiral Calendar.

Saturday, March 22, 2014

Helio Saturn Uranus 3/24/2000 and 3/30/2014, QQQs to touch $92?

Pretty simple stuff.  Helio S-U square (91’24”) at the high of the dot.com bubble top.


Note that the all time high in QQQs of $120.50 on that exact day straddled the lower edge of the diagonal triangle, in opposition to Uranus and square Saturn.

Now look at the S-U on my often favored date of 3/30/2014:


S-U at an angle of 144*.  Recall that I previously used the much faster Sun Moon movement between 3/24/2000 and 3/30/2014 to project a price of $94 on 3/30/2014.  The internal vectors of a Pentagram drawn to the S-U 144* angle might indicate price will touch $92 on 3/30/2014 as shown on the chart.

Now let’s look at the movement of S-U between the two dates; a shade more than 52*:


The angle of S-U changed 52* in the same time period that the angle between the $120 price on 3/24/2000  price and the 3/30/2014 projected price of $94; 2 X 1.

Just observations.  Distastefully inexact.  As Brad Cowan said in Pentagonal Time Cycle Theory, involving the smaller, faster planets in projections greatly narrows the timing window.  Wheels within wheels.  S-U seems to throw some weight behind the previously posted target date of 3/30/2014 and target price of $94.

Keep in mind, as well, that Saturn moved exactly 180* between the two dates.


Jim

Fun with Gann vectors in a 2002 to 2014 square

I had to remove 20 or so vectors and time measurements that I thought significant to make this chart halfway presentable.  Define the price extremes of 2002 bottom, 2007 top, 2009 bottom 12/31/2013 top (to date) as a square (dark blue square) and start drawing some line (all angles drawn with a step multiple of 2.46 which is the price rise from 2002 to 2013 divided by the calendar days):

Just to name a few, the black vector at the southwest corner perfectly intersects the 12/31/2013 top.  The yellow vector from the northwest corner intersects the 10/2007 top and June 2012 bottom.  The green vector drawn from the 3/2009 bottom intersects the yellow Gann angle at the July 2011 secondary top before the 2011 panic.  The same green angle drawn from the bottom of that 2011 panic (point F) intersects the 12/31/2013 top.  I could go on with this visual geometry for hours.  Days.
The math of the square isn’t clear cut.  Here’s a couple items:

I can’t draw a lot from those metrics at first glance.  No ‘happy ending.’

Hmmm, what would these metrics look Gann angles used a step of 2.446 computed above?  Appears to me the box is a market work in progress, but one near completion given nearly 3 months have transpired since the above box ended.

Jim